1/6
Arab spring Data visualization
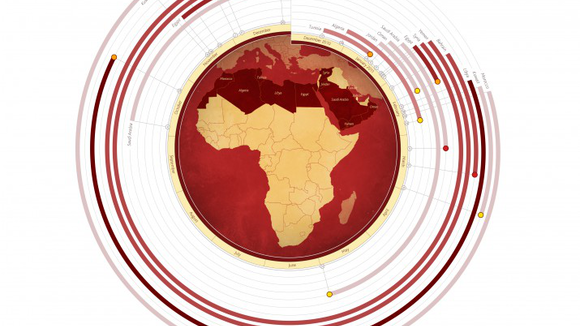
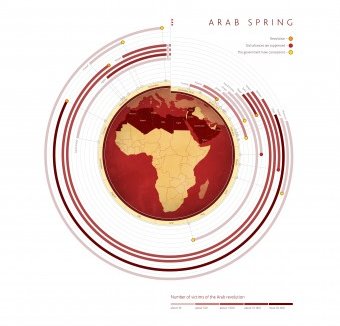
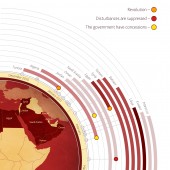
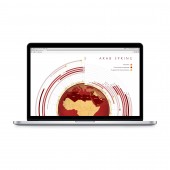
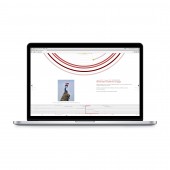
Project is a spiral styled timeline which marked as the beginning and end of the conflict. And at the end of the conflict dates are markers indicating the outcome of the conflict. Saturation of the line is the number of victims of the revolution. So we can observe basic time pattern of historical moments.
发布于2018-12-25
设计师
Kir Khachaturov
设计奖项
A’设计大奖
2014 年
颜色
相关推荐
