1/1
MapStation
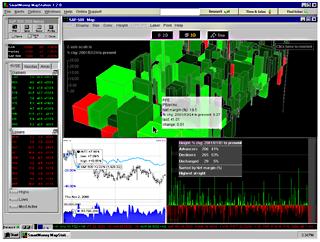
Using innovative data visualization techniques, MapStation allows investors to analyze the hidden structure in the stock market. Three-dimensional blocks symbolizing stocks represent a range of data, from basic measures like market cap and price change to extended stock data. MapStation's compact presentation puts a "face" on data, cutting through informational clutter to reveal underlying trends and patterns. By setting the three dimensions to represent data for which they are screening stocks, investors can easily spot outliers by their extreme color, height, or size.
发布于2020-02-14
设计师
SmartMoney.com
设计奖项
美国IDEA工业设计奖
Bronze/铜奖
2001 年
颜色

